Profiling your site is extremely useful not only for debugging and performance testing but also for learning about how your site handles requests.
Symfony 2 comes with a bundle (like a Drupal module but for Symfony) called WebProfiler Bundle which collects information about each request made to your application and allows you to visualize it in the browser.
Drupal 8 doesn’t include the Web Profiler bundle in core. However, there already is a contrib module for it. Make sure to install any dependencies before enabling the module.
The module will render a fixed bar at the bottom of each page for users with the View webprofiler toolbar permission. The bar provides a summary of the collected data from the profiler.
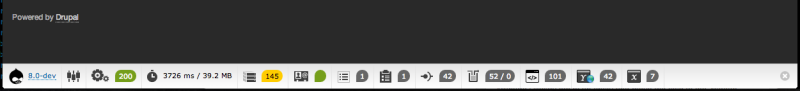
By clicking on any of the items, you will be taken to the full profiler output as shown below. Bear in mind, you'll need the Access webprofiler permission to access this page.
Here is a brief description of what each vertical tab in Web Profiler contains.
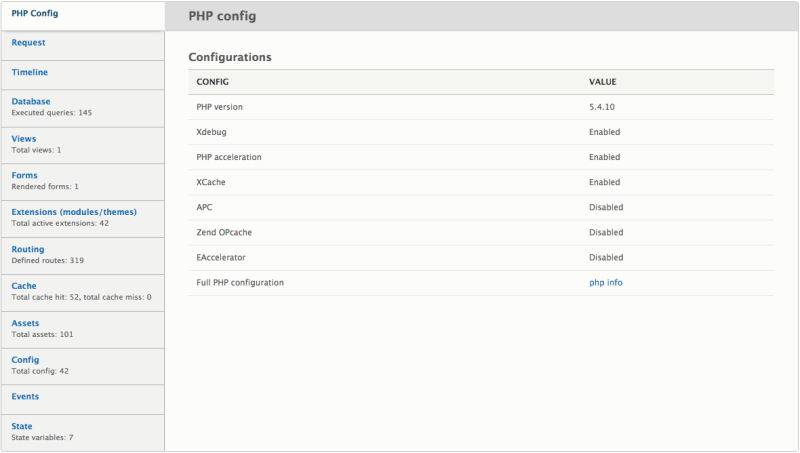
PHP config
View details about your server's php configuration, such as PHP version and enabled extensions. There’s also a link provided which displays your full php info output.
Request info
This provides a wealth of information relating to the page request. You can see which route was matched, the route object, and the route parameters that were passed. Cookies, request and response headers as well as server parameters are also provided. This information can prove very useful when debugging requests.
Timeline
You may already be familiar with the timeline that is provided with DevTools in Google Chrome or the Firefox profiler. These tools are used for profiling the amount of time each part of a page request takes from the initial page call to fetching each resource and finally rendering the page.
The timeline provided by the Web Profiler module is slightly different. It allows you to visualize the order in which PHP controllers and events are called and the time it took to compile them. This is a great way for you to debug slow page loads. It also provides insight into how Drupal 8 core actually renders a page and the different events (like hooks from Drupal 7) that are called in the process.
Database
You may be familiar with the Devel module in Drupal 7 that provided a list of all of the database queries made for the current page and their execution time.
The Web Profiler provides something very similar. All queries are listed in execution order with the ability to filter based on type (e.g. SELECT, INSERT, etc.) as well as the calling class. For each query you can view the list of query arguments, execution time, the PHP file that made the query, including the line number, and the ability to easily run EXPLAIN on the query.
Views
This is a great feature that has been added to the Web Profiler specifically for Drupal. It shows a list of views that were rendered on the current page with their respective build time, execute time, and render time.
Forms
This section lists the forms built on the current page.
Extensions
All of the modules and themes that are enabled on your site are listed in this section.
Routing
The full list of routes (menu items in Drupal 7) that are available along with their path alias.
Cache
The Cache tab is a very useful resource that lists the different caches (by CID) and the respective number of hits or misses.
Assets
Assets provides a list of all of the CSS and JS files that were loaded for this page request. Also, if you scroll right to the bottom you’ll notice JS settings which provides you with your full JS settings as a prettified JSON object.
Config
In the Config tab, you can find the number of times configurations were used for the page request.
Events
Events are similar to hooks in Drupal 7, except that you write listeners that are triggered upon an event. This tab lists all of the listeners that were called and those that were not. It’s extremely useful to see which controllers are being called and in which order.
State
This tab provides you with a list of variables that were accessed in the page request.
Comments
Hi Joe and thanks for this article on Webprofiler!
The latest dev version also has a block collector to show how many blocks are loaded for any single page.
Brilliant!
Tools like these are gold in pinpointing bottlenecks of performance.
Not only do they tell you how big your problem is, they also tell you where it is.
In D7 (and I suspect D8 too) xhprof works nicely.
Any other suggestions, anyone?
Awesome work! Thanks so much!
Hi, Thanks for sharing your ideas here about web profiler. This is such a very interesting article to read. I learned that this profiling is used for a better performance and content handling of a website. In connection with this, I have researched more of the tools and to better understand everything about profiling and its website's speed, just visit this.