Before you can create a path or link to another page on your site, you'll need to know the route (unless there is already a variable available for the URL you need). Finding a route can be a tricky task unless you have the right tools. In this tutorial, we'll show how tools like Webprofiler, Drush, and Grep can be used to get route information for a page, so that you can use functions that need a route as a function parameter.
In this tutorial we'll:
- Learn how to determine the route or path of an internal page.
Goal
Find the route of an internal page.
Prerequisites
- Overview: Routes, Controllers, and Responses
- Twig Filters and Functions
- Downloading and Installing a Module from Drupal.org
- Installing a Module
Check for a helper variable first
If you're editing the template for a specific entity type, for example, node.html.twig, there will almost always be a {{ url }} or similar variable that you can use to link to the entity in question. Make sure you check for an existing variable with the URL either in the documentation or using Twig's dump() function.
Example from node.html.twig:
<h2{{ title attributes }}>
  <a href="{{ url }}" rel="bookmark">{{ label }}</a>
</h2>
For the cases where that doesn't work, or for anyone that wants to understand the details of routes and links, the rest of this tutorial covers how they work.
Routes
Before you can make links to internal Drupal pages you need to be familiar with routes.
If you want to link to an internal Drupal page you need to know the name of the route used to define that page, and what parameters to pass to it. If possible you should not hard-code paths like /node/42 or /about because this might make it impossible for the path to be changed by a content editor.
Learn more about what routes are in Overview: Routes, Controllers, and Responses.
Finding the route for a page
When you navigate to a page in your browser and view the URL in the address bar (http://example.com/node/42), and remove the TLD portion of the URL, you're left with what is called a path (node/42 in this case). Rather than just link to the path node/42 we need to figure out what route this refers to and use the route to generate a path.
Here are a couple of ways you can figure out the route.
Some routes are really common, and can be inferred from following a pattern. Routes to any full page view of a piece of content always follow the pattern entity.ENTITY_TYPE.canonical. Examples include entity.node.canonical or entity.user.canonical. You can also substitute .canonical for some other common routes. All entities have an edit form, which can be accessed via the entity.ENTITY_TYPE.edit_form route. If you want to display the form for editing a user's profile the route is entity.user.edit_form.
Linking to the home page of your site or "/" is really common. But since the route used to render the home page is a setting that can be changed, you can always use the special <front> route as an alias.
You can look at the MODULENAME.routing.yml file for any module to discover available routes. The core/modules/contact.routing.yml file defines this route:
contact.site_page:
  path: '/contact'
  defaults:
    _title: 'Contact'
    _controller: '\Drupal\contact\Controller\ContactController::contactSitePage'
    contact_form: NULL
  requirements:
    _permission: 'access site-wide contact form'
So, if I want to link someone to the system-wide contact form at the path /contact, I would want to use the route named contact.site_page.
Not all routes are statically defined, so sometimes it's easier to use a tool that can give you a list of available routes on your specific site.
Webprofiler
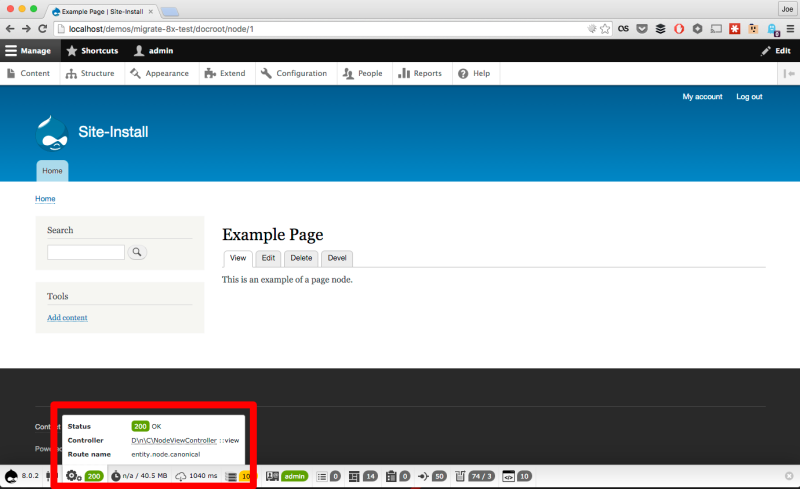
The Webprofiler module makes it easier to find the route for any page on your site. This module is a standalone project that requires Devel. After you download and install Devel and Webprofiler, you will be able to view a toolbar with helpful information at the bottom of every page. Navigate to any page on your site and you can find the route associated with that page from the info provided. This is a tool that should only be used in a local development environment.
Webprofiler can be used to view a list of all available routes by enabling the Routing toolbar item in the module's settings at Configuration > Devel settings > Webprofiler (admin/config/development/devel/webprofiler).
List routes with Drush
Drush has a core:route command that can be used to generate a list of all available routes.
List all routes
drush core:route
Use grep to find specific routes
drush core:route | grep node
See also: Using the Grep Command.
Converting routes to paths
Now that you know what route you want to link to, you're ready to create links.
- To generate a link in a Twig template (in a theme or module), see Create Links with Twig in a Template File.
- To generate a link in a module with PHP, see Generate URLs and Output Links.
Recap
In this tutorial we learned what routes are, and how to determine the route name and parameters that represent a given page.
Further your understanding
- What is the name of the route used to display an individual comment?
Additional resources
- Generate URLs and Output Links (Drupalize.Me)
- Chris Free from Chromatic wrote a great article that covers much of the above and also compares routes to Drupal 7 style paths. (chromaticsites.com)
- Routing API documentation presents a high-level overview of how the system works (Drupal.org)
- Routing API documentation covers the system in depth (api.drupal.org)