Back in August we announced that we were moving our site to Pantheon hosting. Last month we completed the migration and Blake wrote a post about the process. This month I'm going to take a look at some performance comparisons between our previous infrastructure and our shiny new home.
Background
Prior to moving our site to Pantheon it was hosted on Linode, using a couple of different VPS servers that we managed ourselves with a bit of help from Lullabot. Our old Linode infrastructure consisted of a single web server running Varnish, Solr, Memcache, and Apache, along with a few other servers for testing and DevOps. It was always plenty fast. The choice to move to Pantheon wasn't because we hoped for a performance improvement, but still, we thought it would be a fun exercise to see how the change affected the performance of our site.
My hypothesis
They say that if you're going to measure something you should know what questions you want to answer before you start. Because if you go in saying, "to see what happens", that's what you'll do. See what happens. So I wanted to answer this question: How did moving our site from Linode to Pantheon affect the performance–measured in response time–of our site for both members and non-members?
Going into this, I expect that Pantheon will perform better than our previous setup, though I don't really have a sense of how much better. Hosting Drupal sites is, after all, what they do. I don't think our site was slow on Linode, but I also know that there are a lot of infrastructure and performance tweaks we never got around to making because they were never a top priority.
What should I test?
I want to see what response time looks like for various important pages on our site, as well as a few pages that are good samples of common page variants. So I came up with the following list of pages:
- / : Our home page: most people's first impression of Drupalize.Me, and the content dashboard for authenticated users.
- /tutorials : The main listing of tutorials on our site; the 2nd most popular page on our site.
- /pricing : This page is important when it comes to converting users to paid members, so we want to set a good impression.
- /user : Returning users go here to sign in, a common task. This is also the account dashboard for authenticated users.
- /tutorial/core-migration-modules?p=2578 : Example of a written tutorial with an embedded video.
- /videos/build-your-first-page-symfony-3?p=2603 : Example of a stand alone video tutorial.
- /series/drupal-8-theming-guide : Example of a series, or guide, landing page.
- /blog/201607/why-learning-drupal-hard : Example of a blog post with a few comments.
- /search?query=pantheon : Example of a search query.
In the future we might want to test things like navigational scenarios. For example: an anonymous user navigating to a blog post, leaving a comment, and then navigating to the contact page. For now though, we're after some basic response time comparisons. So this feels like a good list.
Set up
Before running the tests I did a bit of configuration on our site to facilitate testing. First, I created a dummy user on both environments and configured it as if it was a normal monthly personal membership. This way I have an account I can use for testing the authenticated user experience.
I also made sure I could answer these two questions in advance:
- Are your tests going to be performed against the live site? If so, do you have a way to quickly abort them?
- Do your tests create dummy content? How are you going to make sure that content gets cleaned up afterwards?
Establish a baseline
I started by gathering some basic information using cURL. We'll use curl to request HTTP headers from the environments, and time to see how long our curl command takes. This will give us some information about the current environment, and a rough idea of what we can expect for a single page request.
Linode
time /usr/bin/curl -I https://drupalize.me/tutorials
HTTP/1.1 200 OK
Date: Fri, 16 Sep 2016 16:24:40 GMT
Server: Apache
Strict-Transport-Security: max-age=15552000
X-Drupal-Cache: MISS
Expires: Sun, 19 Nov 1978 05:00:00 GMT
X-Content-Type-Options: nosniff
Content-Language: en
X-Generator: Drupal 7 (http://drupal.org)
Link: <https: drupalize.me tutorials>; rel="canonical",<https: drupalize.me tutorials>; rel="shortlink"
Last-Modified: Fri, 16 Sep 2016 16:24:40 GMT
Vary: Accept-Encoding
Content-Type: text/html; charset=utf-8
X-Varnish: 2623806 2725564
Age: 23
Via: 1.1 varnish-v4
ETag: W/"1474043080-0-gzip"
Cache-Control: no-cache, must-revalidate, post-check=0, pre-check=0
>> 0.57 real 0.02 user 0.00 sys
Pantheon
time /usr/bin/curl -I https://drupalize.me/tutorials
HTTP/1.1 200 OK
Date: Fri, 16 Sep 2016 16:25:37 GMT
Content-Type: text/html; charset=utf-8
Connection: keep-alive
Set-Cookie: __cfduid=db4a4fc18bf748493351d2d6ae784af911474043137; expires=Sat, 16-Sep-17 16:25:37 GMT; path=/; domain=.drupalize.me; HttpOnly
Cache-Control: public, max-age=900
Content-Language: en
Expires: Sun, 19 Nov 1978 05:00:00 GMT
Last-Modified: Fri, 16 Sep 2016 16:25:24 GMT
Link: <https: drupalize.me tutorials>; rel="canonical",<https: drupalize.me tutorials>; rel="shortlink"
X-Content-Type-Options: nosniff
X-Drupal-Cache: MISS
X-Frame-Options: SAMEORIGIN
X-Generator: Drupal 7 (http://drupal.org)
X-Pantheon-Endpoint: 089c557c-2188-434f-b435-827816b210ba
X-Pantheon-Styx-Hostname: styx480365c9
X-Styx-Req-Id: styx-1bee92be066d604d0c8eb52711752b8a
X-Styx-Version: StyxGo
X-Varnish: 51631136 64695802
Age: 12
Via: 1.1 varnish-v4
Vary: Accept-Encoding, Cookie, Cookie
Strict-Transport-Security: max-age=15552000
Server: cloudflare-nginx
CF-RAY: 2e35ace6dc5a555e-ORD
>> 0.24 real 0.11 user 0.01 sys
The "real" value from the time command is probably the most interesting thing in this output. It gives you a rough idea of how long it takes for the site to respond to a single request. Which basically amounts to: how long does it take Drupal (and all the layers in front of it) to service my request? Shorter is better. In both of these examples you can see the X-Varnish: 51631136 64695802 header, which indicates to me that these anonymous requests are actually being serviced by Varnish, and aren't even making it to Drupal. It's also why they're so fast. In this instance we're really testing the speed at which Varnish can return a page.
Cache busting
What about if we force our requests to bypass the Varnish cache by adding a NO_CACHE cookie?
Linode
time /usr/bin/curl -I -H "Cookie: NO_CACHE=1;" https://drupalize.me/tutorials
HTTP/1.1 200 OK
Date: Fri, 16 Sep 2016 17:15:11 GMT
Server: Apache
Strict-Transport-Security: max-age=15552000
X-Drupal-Cache: HIT
Etag: "1474046080-0"
Content-Language: en
X-Generator: Drupal 7 (http://drupal.org)
Link: <https: drupalize.me tutorials>; rel="canonical",<https: drupalize.me tutorials>; rel="shortlink"
Cache-Control: public, max-age=900
Last-Modified: Fri, 16 Sep 2016 17:14:40 GMT
Expires: Sun, 19 Nov 1978 05:00:00 GMT
Content-Type: text/html; charset=utf-8
>> 0.58 real 0.02 user 0.00 sys
Pantheon
time /usr/bin/curl -I -H "Cookie: NO_CACHE=1;" https://drupalize.me/tutorials
HTTP/1.1 200 OK
Date: Fri, 16 Sep 2016 17:14:23 GMT
Content-Type: text/html; charset=utf-8
Connection: keep-alive
Set-Cookie: __cfduid=d2a7c943f0a16e2620050e4ffe8fd29cf1474046063; expires=Sat, 16-Sep-17 17:14:23 GMT; path=/; domain=.drupalize.me; HttpOnly
Cache-Control: public, max-age=900
Content-Language: en
Expires: Sun, 19 Nov 1978 05:00:00 GMT
Last-Modified: Fri, 16 Sep 2016 17:04:59 GMT
Link: <https: drupalize.me tutorials>; rel="canonical",<https: drupalize.me tutorials>; rel="shortlink"
X-Drupal-Cache: HIT
X-Frame-Options: SAMEORIGIN
X-Generator: Drupal 7 (http://drupal.org)
X-Pantheon-Endpoint: 089c557c-2188-434f-b435-827816b210ba
X-Pantheon-Styx-Hostname: styx480365c9
X-Styx-Req-Id: styx-2efd3f16e56111a76a349f5b3ab8e14b
X-Styx-Version: StyxGo
X-Varnish: 77632744
Age: 0
Via: 1.1 varnish-v4
Vary: Accept-Encoding, Cookie, Cookie
Strict-Transport-Security: max-age=15552000
X-Content-Type-Options: nosniff
Server: cloudflare-nginx
CF-RAY: 2e35f45652fc256d-ORD
>> 0.29 real 0.01 user 0.02 sys
Notice that the X-Varnish: 77632744 header only contains a single ID this time instead of the 2 numbers it showed before. This indicates that Varnish was not able to service the request, and thus passed it along to Drupal. We are still getting cached results from Drupal though: the X-Drupal-Cache: HIT indicates that the content was served from Drupal 7's anonymous page cache.
Authenticated users
So far all the data we've looked at is for anonymous users. That is, people who are browsing our site but are not signed in to their account. As a business that sells membership subscriptions, our goal is to convert anonymous users to subscribers, and subscribers always navigate our site while signed in. So we want to make sure that the experience is a good one for them as well.
Before doing any testing I fully anticipated that the experience would be slower for authenticated users. When you're signed in to our site we customize the experience in a lot of different and unique-per-user ways that make doing things such as caching the HTML of an entire page difficult. The page is unique for each person. So we already know that building the page for an authenticated user is going to be more expensive.
In order to generate authenticated requests using curl we can use the session cookie from a session in our browser. Here's how to find that. Sign in to your site in your favorite browser. Then find the cookie that starts with either SESS, or SSESS followed by a random string. Copy the cookie name, and value, and then use them as arguments to curl using the --cookie flag like so:
curl --cookie "{cookie.name}={cookie.value}"
Linode
time /usr/bin/curl -I --cookie "SSESS77386d408b0660b92f2dbc30c5675085=Xawrv1CllbUwC6ksX3qq7Ya2cbwitQv7xF33baJ2644" https://drupalize.me/tutorials
HTTP/1.1 200 OK
Date: Fri, 16 Sep 2016 17:22:33 GMT
Server: Apache
Strict-Transport-Security: max-age=15552000
Expires: Sun, 19 Nov 1978 05:00:00 GMT
Cache-Control: no-cache, must-revalidate, post-check=0, pre-check=0
X-Content-Type-Options: nosniff
Content-Language: en
X-Generator: Drupal 7 (http://drupal.org)
Link: <https: drupalize.me tutorials>; rel="canonical",<https: drupalize.me tutorials>; rel="shortlink"
Content-Type: text/html; charset=utf-8
>> 0.75 real 0.02 user 0.00 sys
Pantheon
time /usr/bin/curl -I --cookie "SSESS77386d408b0660b92f2dbc30c5675085=Ifrv29Rrk3RZ2DdUWhZDUhmCYzdFw_J0n0p217GXMTY" https://drupalize.me/tutorials
HTTP/1.1 200 OK
Date: Fri, 16 Sep 2016 17:26:45 GMT
Content-Type: text/html; charset=utf-8
Connection: keep-alive
Set-Cookie: __cfduid=d32d0c09a57b7ae447b943ebee6427dc81474046805; expires=Sat, 16-Sep-17 17:26:45 GMT; path=/; domain=.drupalize.me; HttpOnly
Cache-Control: no-cache, must-revalidate
Content-Language: en
Expires: Sun, 19 Nov 1978 05:00:00 GMT
Link: <https: drupalize.me tutorials>; rel="canonical",<https: drupalize.me tutorials>; rel="shortlink"
X-Content-Type-Options: nosniff
X-Frame-Options: SAMEORIGIN
X-Generator: Drupal 7 (http://drupal.org)
X-Pantheon-Endpoint: 089c557c-2188-434f-b435-827816b210ba
X-Pantheon-Styx-Hostname: styx480365c9
X-Styx-Req-Id: styx-22105de3110b076241cad5d6b9e44e61
X-Styx-Version: StyxGo
X-Varnish: 83009225
Age: 0
Via: 1.1 varnish-v4
Vary: Accept-Encoding, Cookie
Strict-Transport-Security: max-age=15552000
Server: cloudflare-nginx
CF-RAY: 2e3606762f2f2597-ORD
>> 0.81 real 0.01 user 0.01 sys
| Linode | Pantheon | |
|---|---|---|
| Anon. + Varnish/CDN | 0.57 | 0.24 |
| Anon. + No Cache | 0.58 | 0.29 |
| Authenticated | 0.75 | 0.81 |
This shows that for a single request Pantheon significantly outperforms our Linode setup, but that Linode handles authenticated requests slightly better.
Calculating concurrent users
The above tests really only measure the performance of a page without accounting for load. We've just learned how fast a page from our site can theoretically be served, but this doesn't really tell us much about the underlying infrastructures ability to handle multiple concurrent users.
Individual page time is the thing we can affect the most as developers, but the underlying infrastructure impacts concurrency. When load testing we're not necessarily testing how fast Drupal or any of our custom code is. We are actually testing how well the given infrastructure can handle Drupal and our custom code while serving multiple users at the same time. In order to gather some more data I performed a load test, simulating normal load on our site.
So, what is normal load?
One way to approach this is to determine the average number of concurrent users you expect to be using your site and then run your test with that many users. I did this by looking at our Google Analytics stats for the last month and doing some quick math in order to calculate the average number of people actively using our site at any given time.
Total session for last 30 days: 48,585 Average length of each session: 6 minutes 32 seconds (392 seconds)
concurrent_users = (total_session_for_month * average_time_on_site) / (3600 * 24 * 30)
7.34 = (48585 * 392) / (3600 * 24 * 30)
Another, and perhaps more common, use for load testing is to try and get a sense of whether or not your application is going to hold up when you get a traffic spike on awards night. A site like Grammy.com for instance sees relatively little traffic 364 days out of the year, but on awards night, that traffic spikes to extremely high levels. In order to ensure that the site remains available during that traffic spike you might try and calculate the number of users you think will use the site in the given period and run that simulation instead. The end result is still X concurrent users.
For good measure, when load testing I would usually add 10% to this number.
Use Siege
I'm not going to cover this here, but another technique for getting an idea of how well a page performs is Siege. The difference is tools like Siege make multiple concurrent requests and average the results so you get a more accurate picture. Our example above could be suspect to network latency, and other variations, that skew the results. So an average might a bit more accurate.
Read more about using Siege to test the performance of your site in this blog post from earlier this year.
Using JMeter
Instead, for this test I'm going to use Apache JMeter to configure a test suite, and then run those tests via BlazeMeter.
Apache JMeter is a Java application that can be used to load test web applications. It is highly configurable, and can be used to simulate virtually any scenario you can imagine. In addition it can be used to simulate any number of concurrent users. It comes with a complete set of plugins for graphing and analyzing test results.
At a certain point you're going to want to simulate more users than your laptop has the resources for. JMeter has the ability to perform distributed testing by setting up a master instance that delegates to any number of slave machines to do the heavy lifting. Thus, you can scale your tests to any size. BlazeMeter is a service that understands how to read a JMX test file, and do this autoscaling for us. Bonus!
So here's what I did.
I started by installing the BlazeMeter Chrome plugin, which effectively allows you to record your active browser session, turn it into a JMX file, and upload it to BlazeMeter. This was a great way to perform some quick/simple tests.
I then downloaded those tests and opened them in JMeter so I could further tweak the scenarios and learn a bit more about how JMeter works. This ended up being great because I could run/debug my scenarios locally, and even do some initial testing for lower levels of concurrent users. I actually had a lot of fun playing around with JMeter once I got the hang of it.
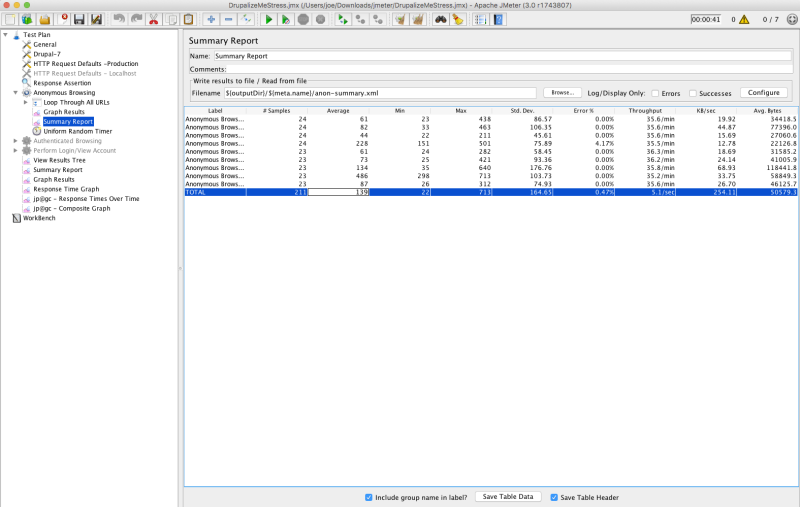
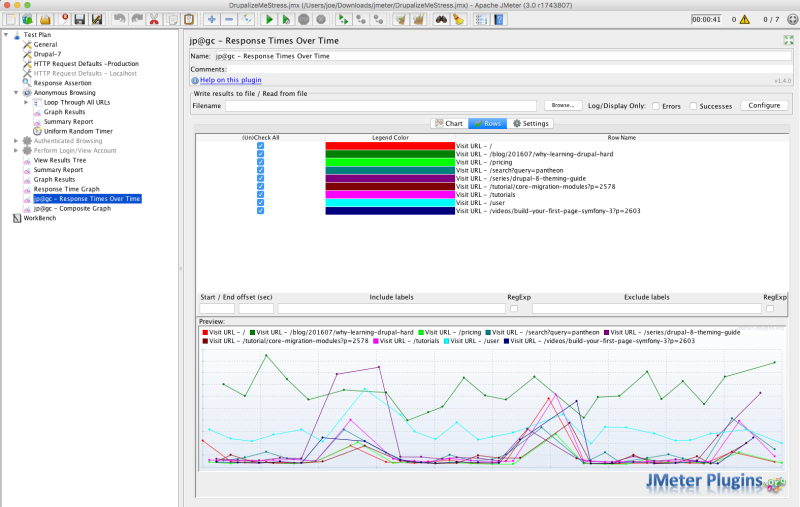
Remember that list of URLs above that I wanted to test? I configured JMeter to read in a list of URLs from a CSV file, and then set up scenarios to test the set of URLs both as an anonymous user, and as an authenticated user. Finally, I generated lots of graphs because I love graphs.
I then ran those scenarios from my localhost a couple of times, both on the Linode instance of the site, and on the Pantheon instance. In both cases, I had 7 concurrent users, and just for a few minutes, mostly as a litmus test. This still produced some useful information. JMeter allowed me to export a summary of response times from the tested URLs to CSV files, which I then imported into Numbers to make even more graphs.
This simple comparison allowed me to get a sense of how both Linode and Pantheon perform for each URL and for both anonymous and authenticated users.
This data represents the response time that you could expect as a user when our site is under normal load.
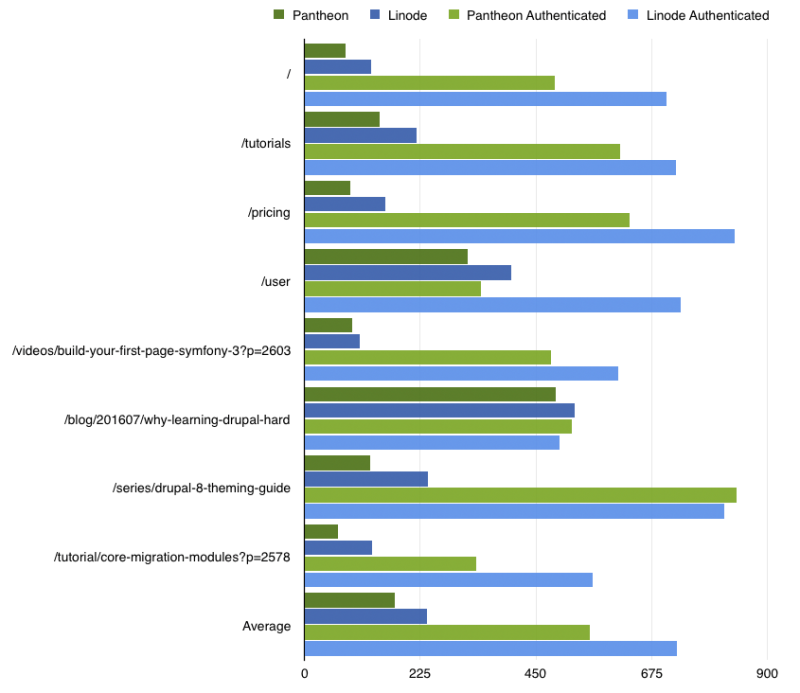
Overall, this shows positive gains for almost every scenario on Pantheon. In most cases the gains are in the range of 30 to 50ms. In some cases, like /user for authenticated users (viewing your account dashboard), the gains are actually quite substantial: Linode 731ms vs. Pantheon 343ms.
Check out the JMX files for the above tests (which are also used below). Perhaps they will be useful as a starting point for your own load test suite.
BlazeMeter
Of course, those numbers are reflective of what you can expect if you're the only person using the server at a given time. What about the more likely scenario where you're sharing resources with a number of other users? Remember how we calculated concurrent users earlier?
To test this, I uploaded the JMX files from my JMeter tests above to BlazeMeter. I then used their free plan, and maxed out all available resources. 50 concurrent users for 20 minutes with a ramp up time of 900 seconds. So start with 1 user, and gradually increase to 50 over the course of 15 minutes and then continue to stress test with 50 concurrent users for an additional 5 minutes.
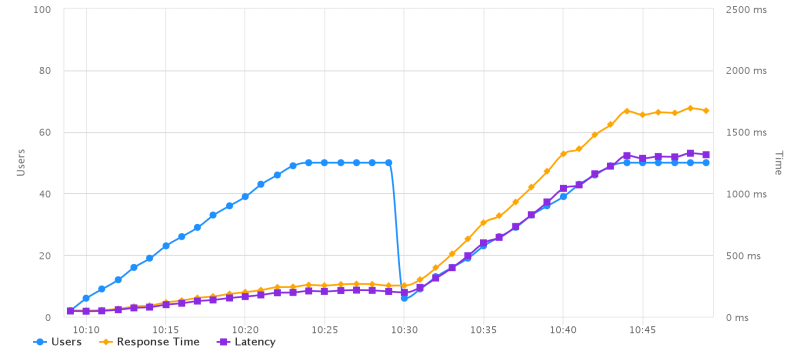
I ran this test once for Linode, and once for Pantheon. Because my JMeter tests contain 2 thread groups (one for authenticated users, one for anonymous users) and BlazeMeter runs each group separately the resulting graphs show two distinct scenarios. The first 20 minutes is anonymous traffic, and the second 20 minutes is authenticated.
Here's a comparison of average response times from all scenarios for the two. Linode in blue. Pantheon in yellow.
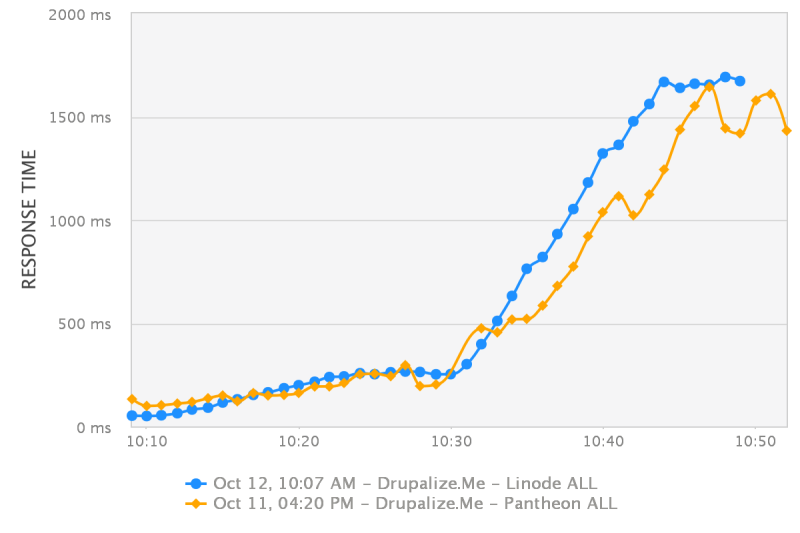
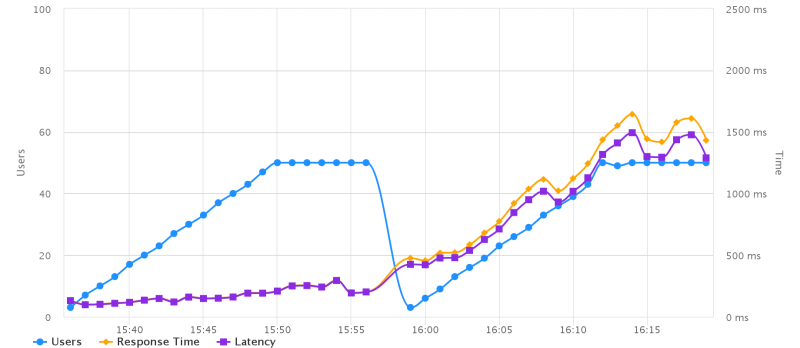
The following graphs show response time relative to number of concurrent users. In both cases you can see that adding more anonymous users has very little impact on overall response time. This is to be expected, as this should essentially all be cached by Varnish. On both environments I would anticipate that you could continue to increase the number of users (blue line) with little to no real effect on the response time (purple line).
Where it gets interesting is the second part of each graph where it shows how adding more authenticated traffic impacts the response time. My analysis of these graphs shows that for just a couple of authenticated users Linode performed marginally better than Pantheon. However, as the load increased, response times decreased more rapidly for Linode than Pantheon.
Linode
Pantheon
Summary and conclusions
I don't have a whole lot of experience doing load testing so this was a fun experience for me. I got to learn some new tools, and look at a lot of pretty graphs.
I tested response time, using various methods, for both anonymous and authenticated traffic on the Drupalize.Me site in order to get a sense of how the move to Pantheon for hosting impacted performance. Verdict? It was a good choice. Pantheon performs better in almost every case. Although the difference is generally expressed in changes like 50 milliseconds, the perceived length of a millisecond is pretty significant to users of our site.
As I said at the start, this is basically the outcome I expected. Though I was prepared for the differences to be bit bigger, any win is a big win when it comes to performance. In addition, these are wins that we gained by allowing someone else to manage our hosting infrastructure for us, which is an important win itself. As we've pointed out in previous posts in this series, this change allows us to focus more on producing the best Drupal training material. Pantheon can help us make sure you get it super fast.
Next steps
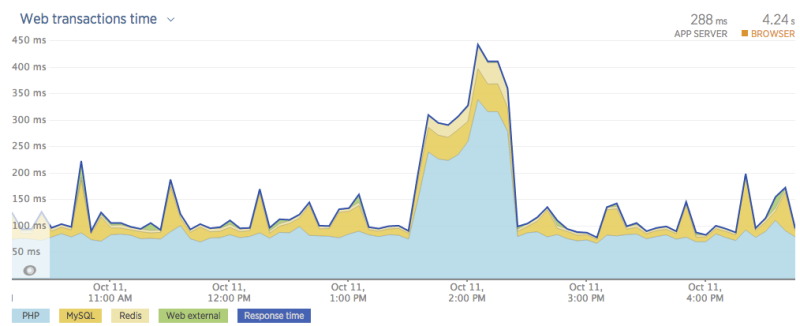
In addition to the already faster response times, I'm super excited about some of the tools that Pantheon provides us that will help us make this even better in the future. For example, we now have access to application profiling data from New Relic. I've barely started digging in yet, but I've already noticed a couple of SQL queries we could either cache or eliminate to shave off quite a lot of time on the front page and pricing page when loading from a stale cache.
Pantheon also supports PHP7. Combine that with their MultiDev tools and we can pretty easily test our site on PHP7, see if everything works, then easily apply those same changes to our live environment. I anticipate that will bring yet further speed increases.
Resources
Want to do some load testing yourself? Here's some resources I found useful when figuring this all out:
- Example JMX file with actions for anon and authenticated traffic for both Drupal 6 and Drupal 7 - https://github.com/jacobSingh/Drupal-Performance-Testing-Suite
- Pantheon has an article about using BlazeMeter https://pantheon.io/docs/guides/load-testing-with-blazemeter/
- Good article about filling in Drupal forms with JMeter - https://www.phase2technology.com/blog/using-jmeter-to-test-performance-of-drupal-with-authenticated-users/
- Related, load testing with Siege https://drupalize.me/blog/201507/load-testing-your-site-siege</https:></https:></https:></https:></https:></https:></https:></https:></https:></https:></https:></https:>