Earlier this year, my colleague wrote about how we've started using CasperJS at Lullabot to perform regression testing. I didn't have much chance to dig into it until recently, when we decided to implement some tests for Drupalize.Me. So far, I'm really enjoying CasperJS—except when something in my test simply doesn't work, and I spend hours asking CasperJS to take screenshots using console.log(), trying to discover what's happening. Fed up with this process, I wanted a debugger...
CasperJS Under The Hood
Under the hood CasperJS serves as a driver for PhantomJS, a headless, WebKit-based, browser. When you write commands in CasperJS like casper.click('a#about');, CasperJS acts like the test monkey clicking on the link to the about page in the PhantomJS browser. As such, when we're writing and running tests with CasperJS we also have access to everything that PhantomJS can do. And one of those utilities is entering into remote debugging mode.
When you run casperjs at the command line the casperjs utility passes along any options to PhantomJS, so any of the command line flags documented on the PhantomJS website will work as expected. This includes the --remote-debugger-port, and --remote-debugger-autorun flags. When the --remote-debugger-port flag is set, PhantomJS starts up your script within a debugging harness and listens on the specified port. With the debugging harness started, PhantomJS permits inspection of the currently running script, and the page that it's accessing, via any other WebKit-based browser.
Let's combine this with CasperJS and see it in action.
Debugging A Simple CasperJS Test
For the Drupalize.Me site we've got a script that performs some basic tests on our Library page. The code for these tests is in the library.js file, and looks something like this:
/**
 * @file
 * Tests for /videos page.
 */
(function() {
  casper.test.begin('Library page accessible for anon. users.', 3, function suite(test) {
    casper.start();

    casper.thenOpen('http://dev.drupalize.lan/videos', function() {
      test.assertExists('.videos-list li', 'There is at least one video listed.');
      test.assertNotVisible('.videos-list li.collection:first-of-type .series-list', 'The series list is collapsed.');
      this.click('.videos-list li.collection:first-of-type a.show-list');
      test.assertVisible('.videos-list li.collection:first-of-type .series-list', 'The series list is visible after clicking the toggle.');
    });

    casper.run();
  });
})();
If I want to run those tests with CasperJS I would use a command as shown below. The library.js script would be loaded, all the tests would run, and the session would exit. Nothing too exciting here. But also, little to no useful output when trying to figure out what's going on inside PhantomJS while the test is running.
casperjs test library.js
Enabling The PhantomJS Remote Debugger
Ready to start debugging? Here's what you'll need to do.
- Enable remote debugging when executing your tests.
- Set a breakpoint in your test file.
- Launch the remote debugging interface.
- Be a Ninja.
You can enable remote debugging by passing the --remote-debugger-port=9000 flag, which will instantiate CasperJS and PhantomJS, and then halt execution. Your library.js script won't be loaded yet however since the debugger is halting at the first line of code it encounters. Since we're not trying to debug CasperJS or PhantomJS itself, we're going to use a little trick to skip ahead in our debugging session to the part we're actually interested in.
Add the debugger; keyword to the library.js script, or whatever script you're trying to debug. Our code will look something like this now:
debugger;

(function() {
    // .. do testing stuff ..
  });
})();
This is the equivalent of setting a breakpoint in your script and it tells the debugger that once it starts running it should halt when it gets to this line.
Now run this command:
casperjs test --url=http://dev.drupalize.lan library.js --remote-debugger-port=9000
This starts up CasperJS and PhantomJS and just halts. It hasn't started running our test yet, and thus hasn't hit our breakpoint. Before it'll proceed any further we need to tell the debugger to go ahead and start running the code.
You can access the debugger by navigating to http://localhost:9000 in your WebKit-based browser of choice and you'll be presented with a page that contains a single link. Likely titled about:blank. If you click that link it'll open the WebKit inspector, and if you've ever debugged JavaScript before things should start to look pretty familiar at this point.
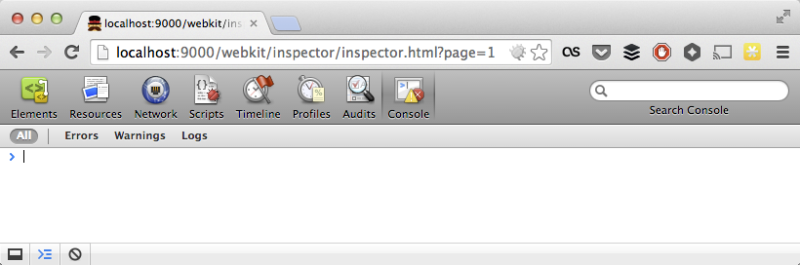
In the inspector navigate to the Console tab, and run the following command in the Javascript console.
__run();
This tells the PhantomJS debugger to go ahead and start execution of the script. And everything will just chug along like normal–until it hits that debugger; line that is. When it does... BLAM! Execution is halted, and the WebInspector shows us our library.js script, and the line on which it halted. And then things get awesome.
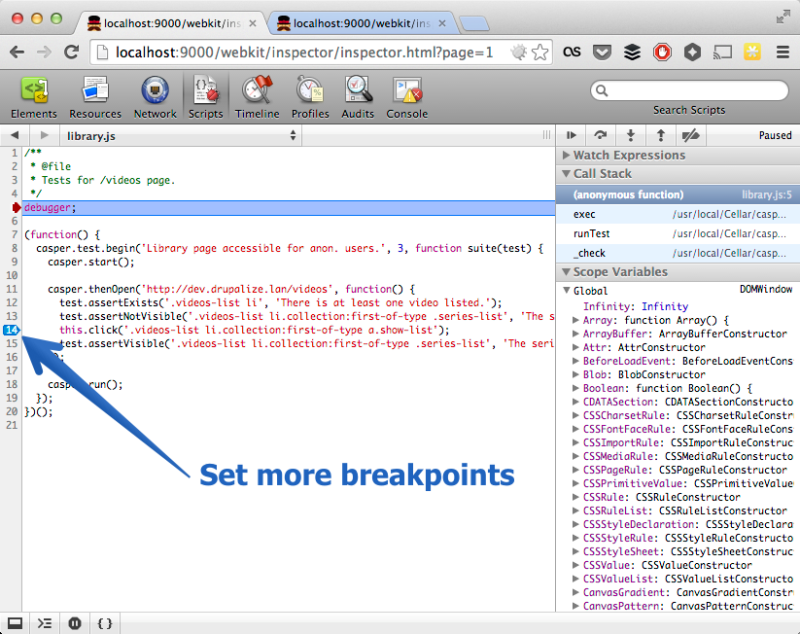
From here you can use the JavaScript debugger just like you would if you where viewing any other page. Set breakpoints, step through the code, and inspect variables. Ready to have your mind blown?
Set a breakpoint somewhere inside your CasperJS tests so that execution halts after a point at which CasperJS has instructed PhantomJS to load a page. Then hit the play button and let the script run until your new breakpoint. Execution halts again, and won't continue until you hit play. During this time before you hit play you can navigate over to the Console tab and inspect what's been going on.
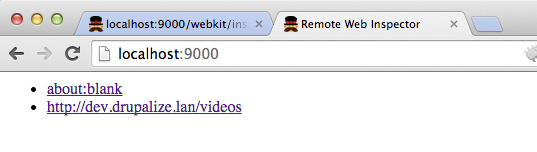
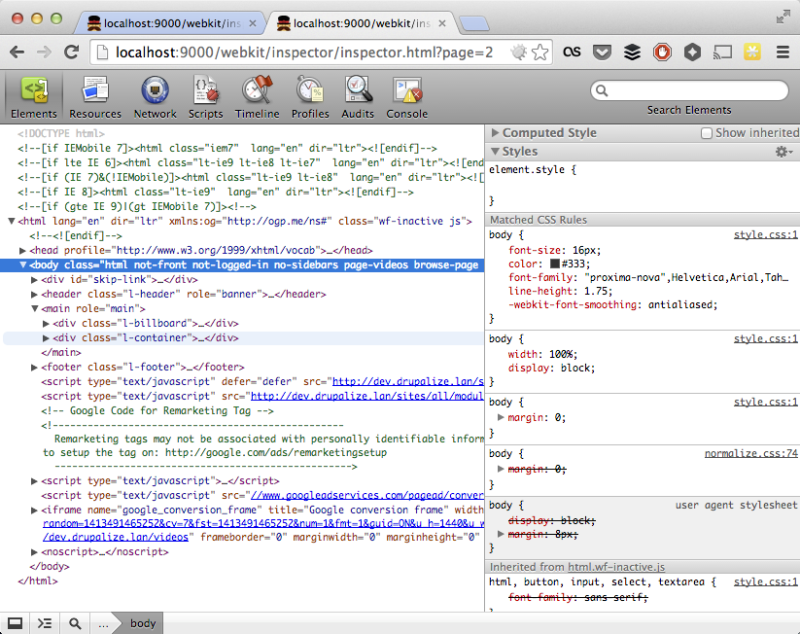
Here's the real kicker though. Open another window and navigate to http://localhost:9000 again. This time you'll see two links. One for about:blank and another for the site that PhantomJS is currently navigating. That's right, you can now open a second WebKit inspector and start inspecting the page that PhantomJS is currently looking at. No more taking screenshots, and dumping HTML into files so you can inspect them after the tests have run. You can now see exactly what PhantomJS, and thus CasperJS, are looking at in real time.
Happy debugging.
Comments
Hello,
I trying to do this on chrome.exe and windows but not understand the sequence of the steps:
1) command-line casperjs test c:\temp\mytest.js --remote-debugger-port=9000
2) open chrome and field url: http://localhost:9000
3) on console i do: __run();
but chrome doesn't show me the links like your safari.
this is my code:
debugger;
casper.test.begin('Google search retrieves 10 or more results',3, function suite(test) {
casper.start("http://www.google.com.br/", function() {
this.echo(">>Number 1");
test.assertTitle("Google", "Title home page google");
casper.echo(">>Number 2");
test.assertExists('form[action="/search"]', "find form search");
casper.echo(">>Number 3");
this.fill('form[action="/search"]', {
q: "casperjs"
}, true);
this.echo(">>Number 4");
casper.capture('test.png', undefined, {
format: 'png',
quality: 75
});
})
casper.run(function() {
test.done();
});
});
After running the casperjs command with the --remote-debugger-port=9000 flag does casper start up but then halt? At that point you should be able to navigate to http://localhost:9000 and see a link on that page like "about:blank", which if you click will open the console. If casper isn't halting, and instead runs your tests without waiting of for you to type __run() it seems like it's not getting caught by the PhantomJS debugging harness.
I do hope to replicate this wonderful lecture at my own time. I looked at it, never knowing it existed, and I can only say: THANK YOU.
This has been very useful, it will save a bunch of head scratching!
God? Is it you?
Super useful!
Thank you so much!
Hey Joe!!
This is just awesome!! I was having a tough time trying to debug my casperjs app.
Thank you very much!
works perfectly, but I don't know how to switch from the webkit inspector to the actual browser render at the last step
You won't actually be able to see a rendered version of the page. But you can see the HTML that is generated for that page/step. If you open http://localhost:9000 while the debugger is paused, you'll have two links. One for about:blank and the other that is a link to the page that the PhantomJS browser is currently viewing. If you open the second link, you can use the inspector there to view the same HTML that PhantomJS is seeing.
Hope that helps.
Ah,, that's a shame.. my game is inside a canvas object so the dom structure isn't really useful... but this debugging technique is still really helpful, thanks a lot.
This is awesome, it solved hours of headbanging. Thank you.
I am not getting how can i implement this with phantomjs and JAVA code i am writing. CAn you help please?
This is fantastic!!! Wow, this is going to save me an incredible amount of pain, thank you so much!
Thank you for make it happen! You save me a lot of time and energy!
Hmmm... would love to use this. However, when I open localhost:9000 I only see one link - the about:blank link is missing. Do you have any idea what could cause this problem? Thanks a lot...
Did you start a debugging session by adding a
debuggerstatement to your JS and then executing the__run()function in the console of the about:blank inspector? It's kind of a two step process. Load localhost, use about:blank session to start a debugging session, then in another window load localhost again and you should have the second link.Thanks for the swift reply! Yes - I do have the debugger statement in my casperjs test script. However, as soon as I head to localhost:9000 (after starting casperjs with the remote-debugger option), I see only one link: file:///usr/local/lib/node_modules/casperjs/bin/bootstrap.js - no link to about:blank.
Honestly, I'm not really sure what would cause that to happen. When you run the casper command does it halt execution like as if it is waiting for the debugger to start before beginning to run your steps? If you co to the link for bootstrap.js does that give you a web inspector that you can use to start the debug session?
Same as @itsame69. I'm on Windows 7, using Chrome.
Trying to execute __run() in the console on that page does nothing either, nor any other command ( eg 2*2 )
I wonder if maybe things changed with recent versions? I haven't really used this since I wrote the blog post over 2 years ago now. What versions of Capser, and Phantom are you using? I wonder if something changed that changes the workflow for this?
I can't run the instruction __run();
how can i solve this problem?
Any help would be appreciated.
My suspicion is that this is related to using a recent version of PhantomJS. I haven't used this technique, or PhantomJS in a couple of years, and there's a good chance it's changed. What version of PhantomJS are you using?